Recently I was doing Bayesian analysis and wanted to visualize the prior and the posterior distribution of one of my parameters in one plot to see whether I had a strong mismatch between prior and posterior. I searched around a bit and find a useful solution here that I adapted and improved.
I was working with a normal(0.5, 0.5) prior and had posterior draws generated by Stan. However, the plots of course works for every type of histogram that you want to make.
Here is the function code:
The function allows you to define an upper limit. Similarly, you can also implement a lower limit if you like. In general it makes sense to define the breaks not by the number, but by specific break points. That is what pretty() does, specifying evenly spaced good looking break points. The while loop makes sure that none of the data points accidentally fall outside of the first / last break point. The histograms are then created, but not yet plotted. This can be more cleanly done by making a first call to plot() and then making a second call to plot() with the option add = TRUE. The function allows you to pass any arguments on to the plot (e.g. the xlab). If you want, you can also extend the function to three or more histograms in one plot.
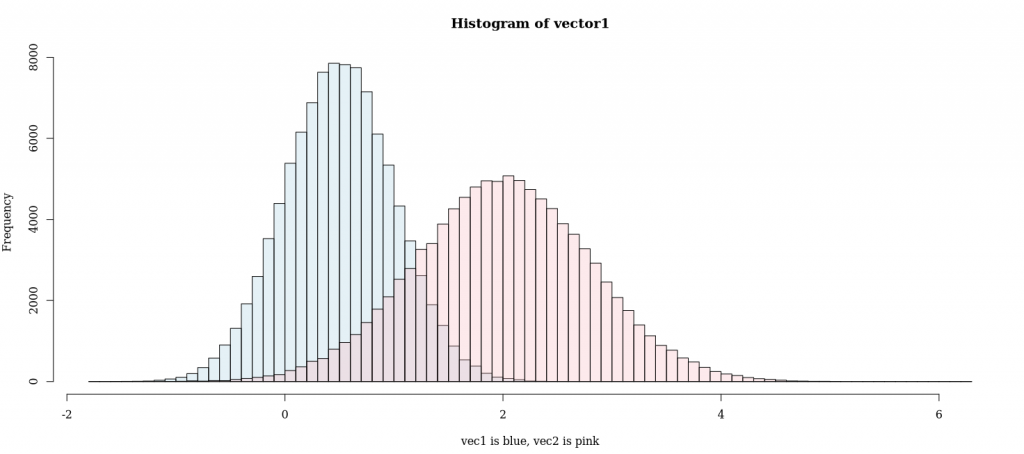
Let’s apply the function:
and here is the output: