
Chess is (unfortunately) a man’s world, and gender differences in chess are large. While the gap in average play is not large between men and women, differences at the top are striking: Among the top 50 players in the world (according to the FIDE Standard Rating List from October 16th) there is not a single woman. Among the top 500 players are only seven (Judit Polgar, Yifan Hou, Humpy Koneru, Aleksandra Goryachkina, Susan Polgar, Jun Xie and Wenjun Ju).
In this post I will argue that the gender gap between men and women is large in most countries. This gap cannot be explained simply by looking at differences in the number of men and women in chess. The code for this analysis can be found here.
Explaining the performance gap
Various explanations have been proposed, pointing to a hostile environment in chess, cultural norms, or differences in innate ability.
Professor Wei Ji Ma recently posted an article on chessbase in which he offered a different explanation. The idea (previously published in this article) is this: Looking at the top performers is a very bad way of comparing two distributions with very different sample sizes.
Let’s say you have a large urn with balls that have the numbers 1 to 100 000 written on it. No you make two piles of unequal size. The first one has 10 balls, the second one has 100 balls. The average between both groups will probably be similar. But if you draw 100 times, you have many more shots at drawing an outlier, i.e. a very high number. The maximum value in the larger groups will therefore probably be much higher, even as you draw from the same urn.
The argument works similarly for women in chess. The FIDE Standard Rating List currently has 7.6% women. A greater number of men means that there is a greater chance of finding exceptionally good chess players. We could therefore see the chess world dominated by men, even if the two distributions were exactly the same.
Permutation analysis
How can we find out whether a difference in top performance is random or systematic? To achieve that, Ma conducted a permutation analysis. Let’s assume the difference between men and women can be explained by sample size alone. If that is true, then it doesn’t matter whether or not we split the entirety of all chess players according to gender or according to any other arbitrary criterion. What matters is only the size of the smaller group and the size of the larger group.
Let us take a random sample of a size exactly equal to the number of all women and call it “small group”. The rest of the players are put in the “large group”. If really only the sample size matters, we should see a difference between top performers of our random “small group” and top performers in the “large group” approximately equal to the actually observed difference between men and women.
If we repeat this process many many times (each time drawing a new random small and large group), we obtain a distribution of differences between the two groups. This allows us to estimate how likely the actual gender difference among top performers would arise purely based on sample sizes. If the difference is more than what we would expect based on sample size, we need to look for other causes.
Professor Ma looked at gender differences in the performance of chess players in India. He finds that the difference between men and women among top Indian players can be fully explained by differences in sample size. In fact, women in India tend to overperform given their small number.
I replicated his analysis and conducted a second one including all chess players from the world. I found results similar to those of Ma in India. For the world, a very different picture emerges.
Performance differences in India
Professor Ma took the FIDE Standard Rating List from October 6th (while I used the one from October 16th). He only looked at Indian players and removed all players born in 2000 and later, arguing that ratings for younger players might be unstable. This left him with 19 064 players, of whom 17 899 (93.9%) were male and 1 165 (6.1%) were female.
I included those born in 2000 in my analysis and ended up with 20 532 players, 19 159 (93.3%) of them male and 1373 (6.7%) of them female. Here are some basic summary statistics of ELO ratings in the two groups:
| sex | number | mean | median | sd |
| F | 1 373 | 1 443 | 1 364 | 319 |
| M | 19 159 | 1 425 | 1 359 | 290 |
And here is the relative distribution of ELO ratings of female and male players in India:
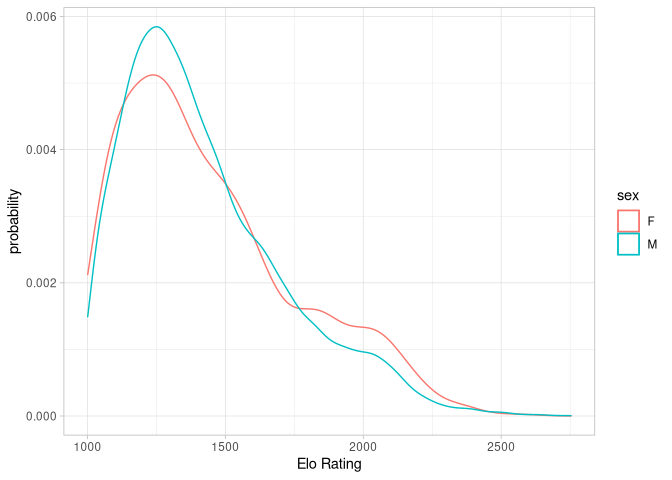
I conducted to different analyses: In one I followed Ma and looked only at the best player in both groups. In the second one, I looked at the average of the top ten players in both groups. For the best performer, the difference in ELO was 167. For the average of the ten best performers, the difference was 269.3.
The results of my permutation analysis large confirm those of Professor Ma. Here are simulated performance differences for the best players:
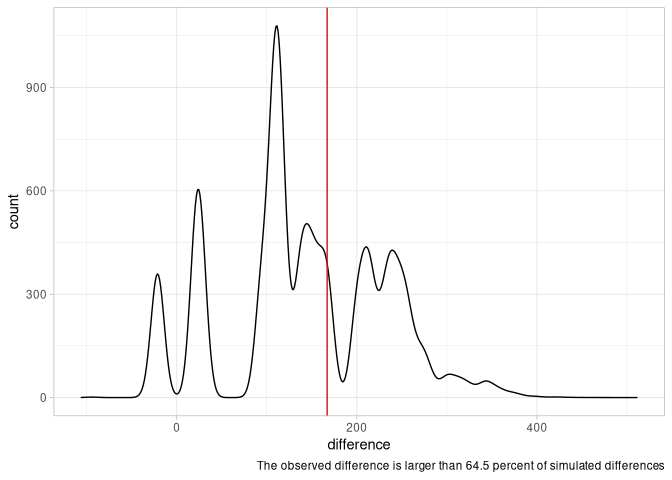
The mean difference in the simulation was 143.47 (compared to an actual difference of 167). Plotting the distribution of simulated differences (black) and the actual observed differences (red), we see that the difference between the best male and female players in India are well within what we expect given random chance. Looking at the summary statistics above, we see that female players also outperform male players on average.
If we look at the average of the top 10 players, a similar picture emerges:
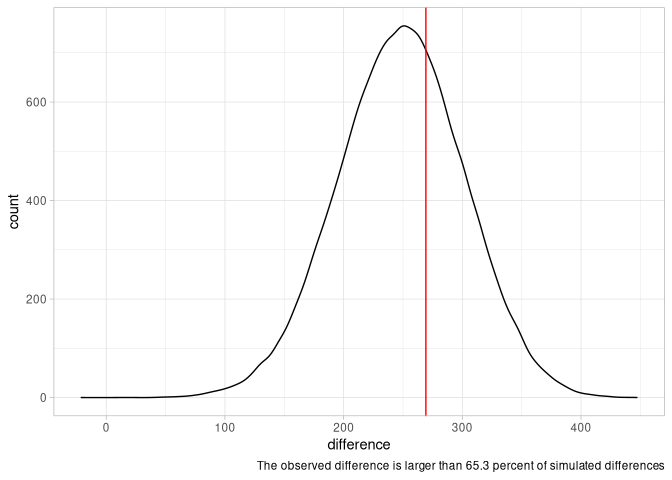
The observed difference (269.3 vs. simulated mean of 248.2) is well within the range expected by pure chance.
Performance differences in the World
Let’s look at the rest of the world. We now have 263 387 players in total, 243 375 (92.4%) of them male and 20 012 (7.6%) of them female. Here are again summary statistics for the two groups:
| sex | number | mean | median | sd |
| F | 20 012 | 1 674 | 1 679 | 317 |
| M | 243 375 | 1 761 | 1 774 | 313 |
And the distribution of ELO ratings:
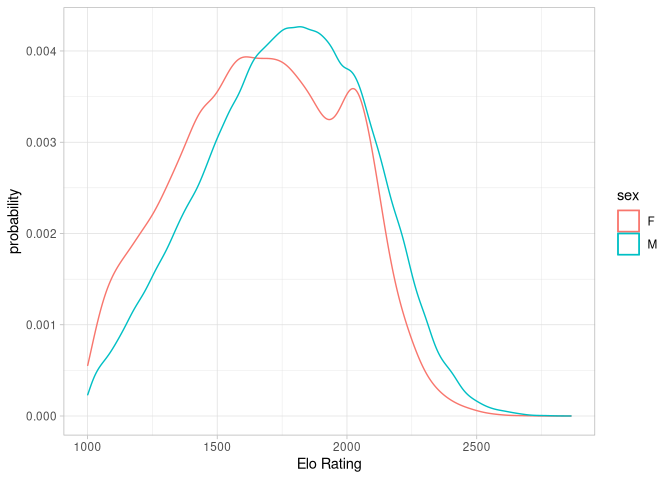
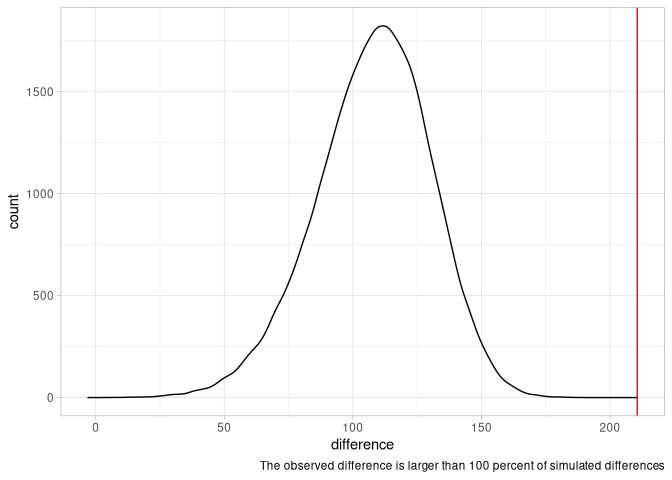
Here it looks like men have a slight advantage over women. The difference between the best male (Magnus Carlsen) and best female player (Judit Polgar) is 188 points. Let’s examine the distribution of simulated differences:

The mean difference in the simulations is 88.46. The actually observed difference (188) is higher than 99.2% of all simulated differences. According to this analysis it therefore seems very unlikely that the gap between men and women can be explained purely by differences in sample sizes.
If we look at the difference between the average top ten players, the difference is even more pronounced. The actually observed difference is 210.6, while simulations suggest an average difference of 107.81. All simulated values were below the difference we actually observe between men and women. This is not good.
Gender differences among countries
We have seen a large difference in gender equality between India and the world as a whole. Even though the absolute performance difference in India is quite large, India actually seems more equitable than the rest of the world. Indian women, on average, perform better than men. The difference among Indian top players is in the range of what we would expect based on differences in sample size.
Let us look at differences in median performance between women and men across different countries (I removed all countries with fewer than 3000 registered players):
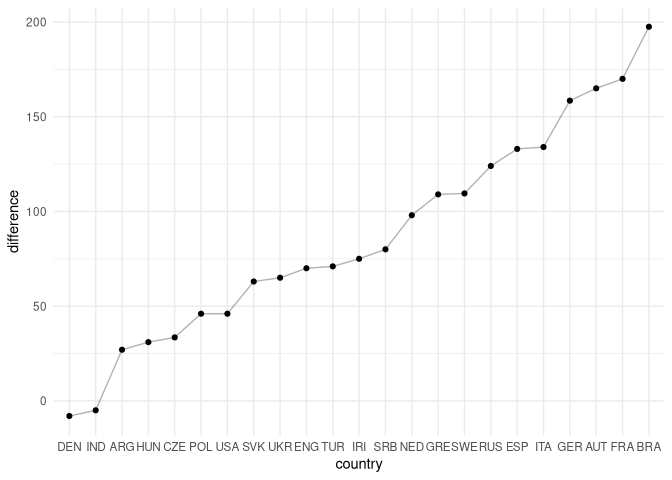
Sadly, it seems, India is an outlier. Almost all of the large chess nations (except Denmark) see men performing better than women on average. This analysis is slightly different from the permutation analysis conducted above. The median, however, should be quite robust to outliers and differences in samples sizes. It is therefore a suitable measure of average performance.
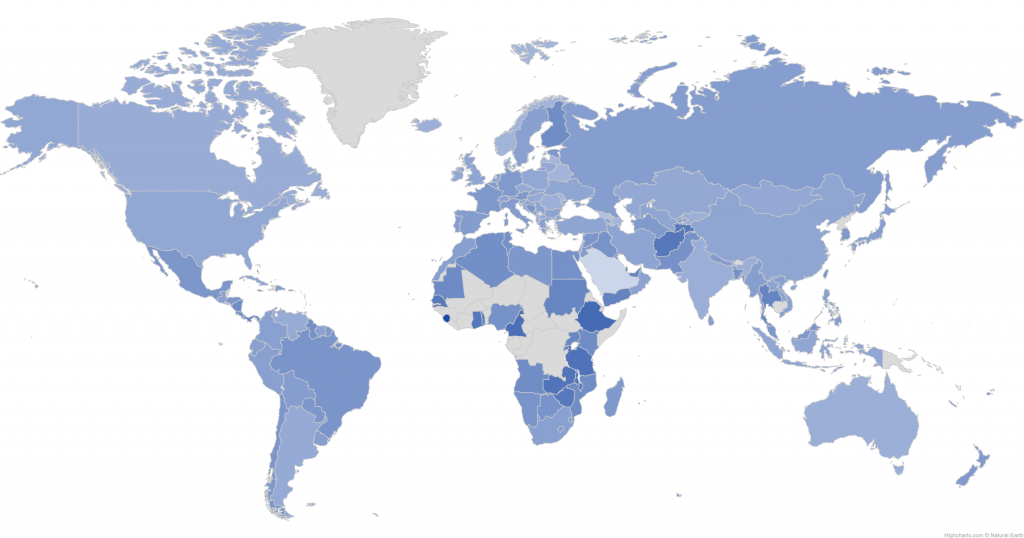
This map shows differences in the median performance of men and women. Dark blue values mean that men are performing better, lighter blue values indicate that women outperform men on average.
What to make of the results
I could confirm Professor Ma’s results regarding the performance of Indian chess players. It seems that indeed, India is one of the more equitable countries. Even though the number of Indian women in chess is relatively small, they do not seem to systematically underperform (and may even be overperforming).
For the rest of the world, the picture looks less charitable. Women perform worse than men on average in most nations.
In search of an explanation, I also looked at the correlation between differences in ELO ratings and the proportion of women in a country. The correlation I found was 0.12. This implies that the participation rate of women in chess can only explain a small fraction of differences across countries.
It seems that overall, chess is not an equitable sport. Outside of a few countries such as India or Australia, men dominate chess across the board (no pun intended). Men perform better on average and the difference in performance among the top players can hardly be explained by sample sizes alone.
I know to little of the chess world to speculate about the causes of the gender gap in chess. But I believe that the low participation rate of women in chess is a pity and that we need to address the systematic challenges women face.
Thanks for the article, very interesting. It seems that the conclusions of the Chessbase article do not generalize to other countries indeed. This was a similar article published yesterday: https://medium.com/@josecamachocollados/the-gender-gap-in-top-level-chess-15591d8990ba
Thanks! I like their analysis and visualizations.
You conclusions clearly are contradicting all the data you provided.
Men are better than women.
it depends a lot on motivation. Why do boys or girls start playing chess ?
It’s the school system. Some few good players want to be professionals,
but that motivation is probably smaller for females.
Can you do the same analysis for being Russian/Nonrussian ?
Why do you say “unfortunately ” or “sadly”? How about the probable comment men are better than women at chess and you bemoaning the fact is discriminatory to me.
Magnus was well above the second best (Caruana at his peak) and 100 above the third one. Magnus is just insanely good. If you took the difference between Judit or Yifan and the third one you would find smaller differences with the simulations
Yeah I think that is a good point. Things are more prone to chance when you’re looking at individuals rather than means…